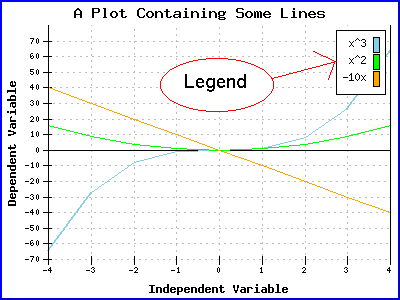
The functions in this section control the legend, which is an optional element on the plot. A legend is usually used to identify each plot line or set of points when a plot contains multiple data sets. A legend can also be used with pie charts to identify the sections.
See also SetTextColor to set the legend text color, SetGridColor to set the legend border color, and SetFont to set the legend text font.
Here is a sample plot with the legend called out.
