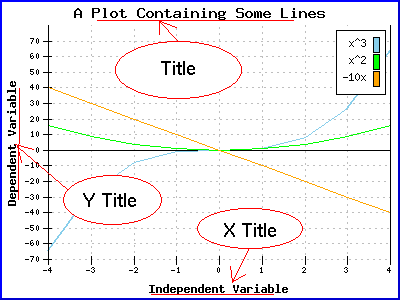
The functions in this section set the title strings: the overall plot title, and optional titles for the X and Y axes.
See also SetTitleColor to set the title colors, and SetFont to set the title fonts.
Here is a sample plot with the titles called out.
