Let's say we want to plot not just one dataset, but several Y values for
each X position. With PHPlot, it is easy to specify the multiple data lines
by just passing in all the Y values for a given X value at once.
So instead of array('label', y),
we specify array('label', y1,
y2, y3, ...).
This is very convenient when working with rows of data from databases.
Now our data will have three Y values for each position on the X axis.
<?php
//Include the code
require_once 'phplot.php';

//Define the object
$plot = new PHPlot(800,600);

//Set titles
$plot->SetTitle("A 3-Line Plot\nMade with PHPlot");
$plot->SetXTitle('X Data');
$plot->SetYTitle('Y Data');


//Define some data
$example_data = array(
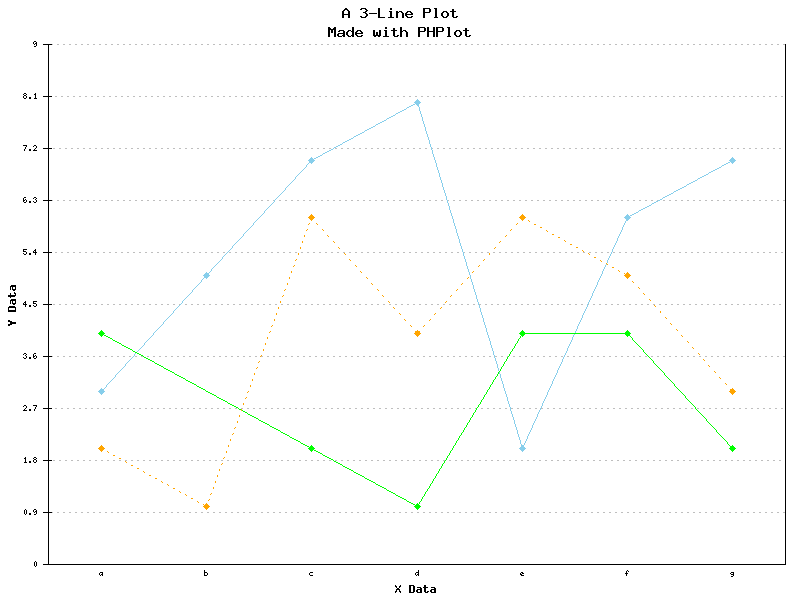
     array('a',3,4,2),
     array('b',5,'',1),  // here we have a missing data point, that's ok
     array('c',7,2,6),
     array('d',8,1,4),
     array('e',2,4,6),
     array('f',6,4,5),
     array('g',7,2,3)
);
$plot->SetDataValues($example_data);

//Turn off X axis ticks and labels because they get in the way:
$plot->SetXTickLabelPos('none');
$plot->SetXTickPos('none');

//Draw it
$plot->DrawGraph();
Which gives us:

Notice that each set of Y data gets a different color. Also the missing data point (label 'b' on the green line) is skipped. This behavior can be adjusted with SetDrawBrokenLines.
This gives you the basics of how to create a graph in PHPlot. A nice start, but now we'd like to add some customization, namely different fonts, margins and types of graphs.