The functions in this section control the optional grid drawn behind the plot. You can independently enable the horizontal (Y) and vertical (X) lines in the grid, and use dashed or solid lines.
See also SetLightGridColor to set the grid color.
Note
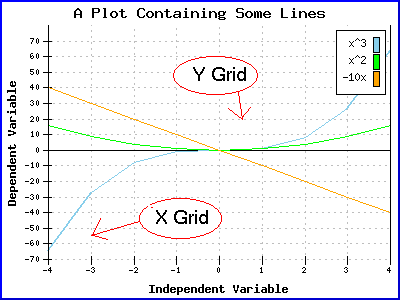
By default, the horizontal (Y) grid is on, and the vertical (X) grid is off.
Here is a sample plot with the X Grid and Y Grid called out.
