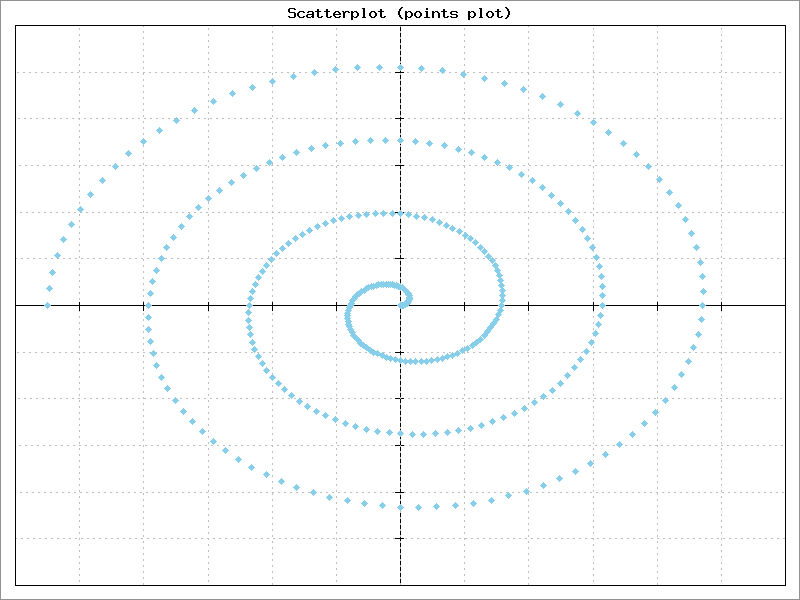
This is a rather contrived example of using a 'points' plot to make a scatterplot. The data array is a set of X/Y points. With 'points' plots, the data can be in any order and duplicate X values are allowed. The points here are generated from R = 0.5 * Theta.
For this example, the X and Y axes and tick marks were moved to 0,0, labels turned off, and plot borders enabled for all four sides.
Example 5.12. Points Plot / Scatterplot

<?php
# PHPlot Example: Point plot - scatter plot
require_once 'phplot.php';

$data = array();
$a = 0.5;
$d_theta = M_PI/48.0;
for ($theta = M_PI * 7; $theta >= 0; $theta -= $d_theta)
  $data[] = array('', $a * $theta * cos($theta), $a * $theta * sin($theta));

$plot = new PHPlot(800, 600);
$plot->SetImageBorderType('plain');

$plot->SetPlotType('points');
$plot->SetDataType('data-data');
$plot->SetDataValues($data);

# Main plot title:
$plot->SetTitle('Scatterplot (points plot)');

# Need to set area and ticks to get reasonable choices.
$plot->SetPlotAreaWorld(-12, -12, 12, 12);
$plot->SetXTickIncrement(2);
$plot->SetYTickIncrement(2);

# Move axes and ticks to 0,0, but turn off tick labels:
$plot->SetXAxisPosition(0); # Is default
$plot->SetYAxisPosition(0);
$plot->SetXTickPos('xaxis');
$plot->SetXTickLabelPos('none');
$plot->SetYTickPos('yaxis');
$plot->SetYTickLabelPos('none');

# Turn on 4 sided borders, now that axes are inside:
$plot->SetPlotBorderType('full');

# Draw both grids:
$plot->SetDrawXGrid(True);
$plot->SetDrawYGrid(True);  # Is default

$plot->DrawGraph();