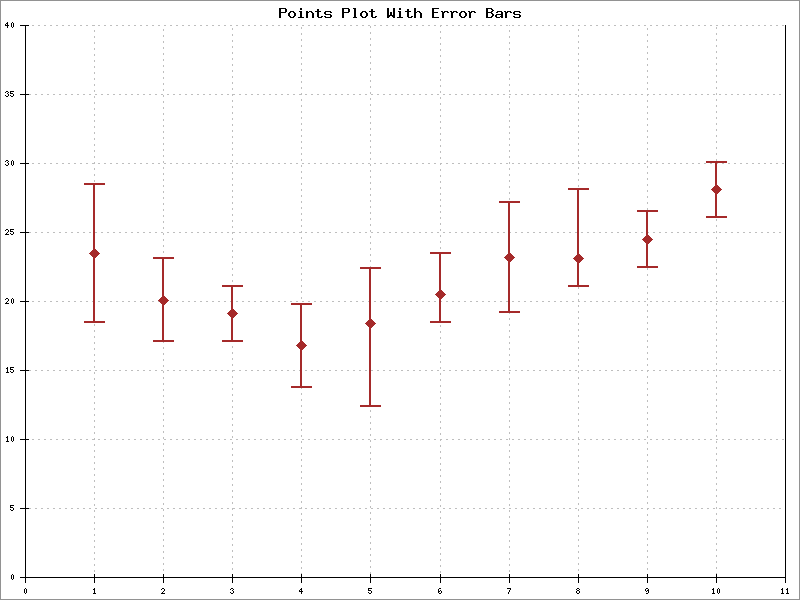
This is a point plot with error bars (as indicated by data type 'data-data-error'). Each point is specified as X value, Y value, Y error in the positive direction, and Y error in the negative direction.
Example 5.11. Points Plot with Error Bars

<?php
# PHPlot Example: Point chart with error bars
require_once 'phplot.php';

$data = array(
  array('', 1,  23.5, 5, 5), array('', 2,  20.1, 3, 3),
  array('', 3,  19.1, 2, 2), array('', 4,  16.8, 3, 3),
  array('', 5,  18.4, 4, 6), array('', 6,  20.5, 3, 2),
  array('', 7,  23.2, 4, 4), array('', 8,  23.1, 5, 2),
  array('', 9,  24.5, 2, 2), array('', 10, 28.1, 2, 2),
);

$plot = new PHPlot(800, 600);
$plot->SetImageBorderType('plain');

$plot->SetPlotType('points');
$plot->SetDataType('data-data-error');
$plot->SetDataValues($data);

# Main plot title:
$plot->SetTitle('Points Plot With Error Bars');

# Set data range and tick increments to get nice even numbers:
$plot->SetPlotAreaWorld(0, 0, 11, 40);
$plot->SetXTickIncrement(1);
$plot->SetYTickIncrement(5);

# Draw both grids:
$plot->SetDrawXGrid(True);
$plot->SetDrawYGrid(True);  # Is default

# Set some options for error bars:
$plot->SetErrorBarShape('tee');  # Is default
$plot->SetErrorBarSize(10);
$plot->SetErrorBarLineWidth(2);

# Use a darker color for the plot:
$plot->SetDataColors('brown');
$plot->SetErrorBarColors('brown');

# Make the points bigger so we can see them:
$plot->SetPointSizes(10);

$plot->DrawGraph();