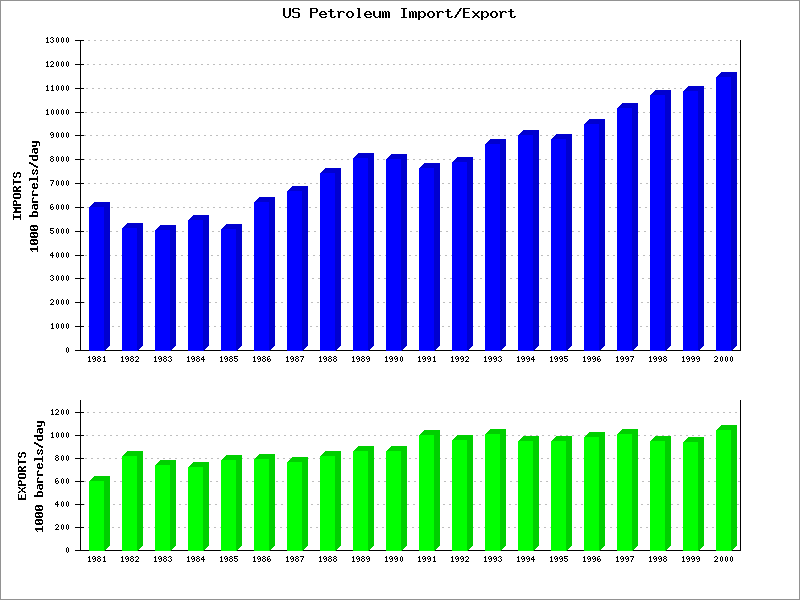
This example shows that it is possible to place two plots on one image. The idea is to disable automatic output with SetPrintImage(0), then define each plot area with SetPlotAreaPixels and create each plot, finishing each with DrawGraph. At the end, PrintImage outputs the image containing both plots.
This should be considered an advanced use of PHPlot and the results may not meet your expectations. Some plot elements are positioned relative to the image, rather than the plot (the overall title, and one coordinate of the X/Y titles, for example). You may also find you need to use SetPlotAreaWorld to remap World Coordinates before each plot.
Example 5.18. Two Plots on One Image

<?php
# PHPlot Example: Two plots on one image
require_once 'phplot.php';

$data1 = array(        # Data array for top plot: Imports
  array('1981', 5996),  array('1982', 5113),  array('1983', 5051),
  array('1984', 5437),  array('1985', 5067),  array('1986', 6224),
  array('1987', 6678),  array('1988', 7402),  array('1989', 8061),
  array('1990', 8018),  array('1991', 7627),  array('1992', 7888),
  array('1993', 8620),  array('1994', 8996),  array('1995', 8835),
  array('1996', 9478),  array('1997', 10162), array('1998', 10708),
  array('1999', 10852), array('2000', 11459),
);
$data2 = array(        # Data array for bottom plot: Exports
  array('1981', 595),  array('1982', 815),  array('1983', 739),
  array('1984', 722),  array('1985', 781),  array('1986', 785),
  array('1987', 764),  array('1988', 815),  array('1989', 859),
  array('1990', 857),  array('1991', 1001), array('1992', 950),
  array('1993', 1003), array('1994', 942),  array('1995', 949),
  array('1996', 981),  array('1997', 1003), array('1998', 945),
  array('1999', 940),  array('2000', 1040),
);

$plot = new PHPlot(800,600);
$plot->SetImageBorderType('plain');

# Disable auto-output:
$plot->SetPrintImage(0);

# There is only one title: it is outside both plot areas.
$plot->SetTitle('US Petroleum Import/Export');

# Set up area for first plot:
$plot->SetPlotAreaPixels(80, 40, 740, 350);

# Do the first plot:
$plot->SetDataType('text-data');
$plot->SetDataValues($data1);
$plot->SetPlotAreaWorld(NULL, 0, NULL, 13000);
$plot->SetDataColors(array('blue'));
$plot->SetXTickLabelPos('none');
$plot->SetXTickPos('none');
$plot->SetYTickIncrement(1000);
$plot->SetYTitle("IMPORTS\n1000 barrels/day");

$plot->SetPlotType('bars');
$plot->DrawGraph();

# Set up area for second plot:
$plot->SetPlotAreaPixels(80, 400, 740, 550);

# Do the second plot:
$plot->SetDataType('text-data');
$plot->SetDataValues($data2);
$plot->SetPlotAreaWorld(NULL, 0, NULL, 1300);
$plot->SetDataColors(array('green'));
$plot->SetXTickLabelPos('none');
$plot->SetXTickPos('none');
$plot->SetYTickIncrement(200);
$plot->SetYTitle("EXPORTS\n1000 barrels/day");

$plot->SetPlotType('bars');
$plot->DrawGraph();

# Output the image now:
$plot->PrintImage();