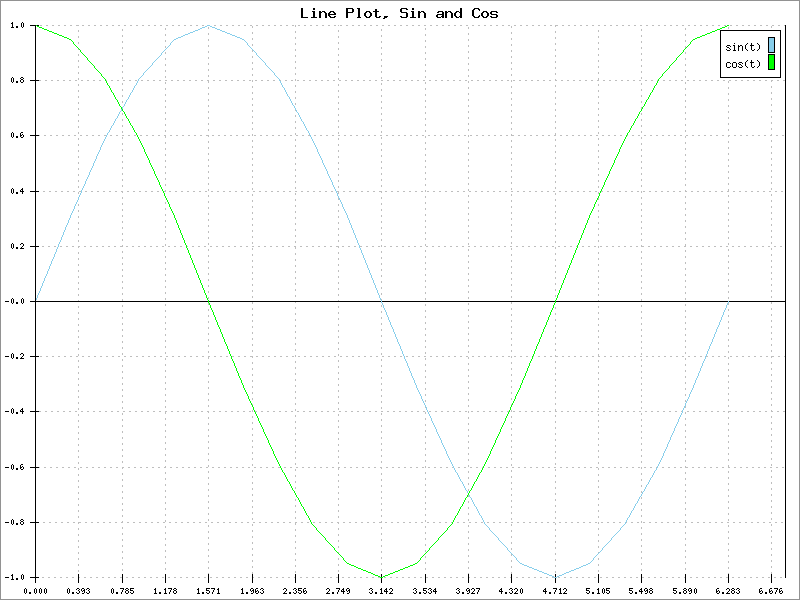
This is a line plot showing the graph of sin(x) and cos(x). This uses quite a few of the PHPlot style control functions to tune the appearance of the plot.
Example 5.2. Line Plot: Functions

<?php
# PHPlot Example: Line graph, 2 lines
require_once 'phplot.php';

# Generate data for:
#   Y1 = sin(x)
#   Y2 = cos(x)
$end = M_PI * 2.0;
$delta = $end / 20.0;
$data = array();
for ($x = 0; $x <= $end; $x += $delta)
  $data[] = array('', $x, sin($x), cos($x));

$plot = new PHPlot(800, 600);
$plot->SetImageBorderType('plain');

$plot->SetPlotType('lines');
$plot->SetDataType('data-data');
$plot->SetDataValues($data);

# Main plot title:
$plot->SetTitle('Line Plot, Sin and Cos');

# Make a legend for the 2 functions:
$plot->SetLegend(array('sin(t)', 'cos(t)'));

# Select a plot area and force ticks to nice values:
$plot->SetPlotAreaWorld(0, -1, 6.8, 1);

# Even though the data labels are empty, with numeric formatting they
# will be output as zeros unless we turn them off:
$plot->SetXDataLabelPos('none');

$plot->SetXTickIncrement(M_PI / 8.0);
$plot->SetXLabelType('data');
$plot->SetPrecisionX(3);

$plot->SetYTickIncrement(0.2);
$plot->SetYLabelType('data');
$plot->SetPrecisionY(1);

# Draw both grids:
$plot->SetDrawXGrid(True);
$plot->SetDrawYGrid(True);

$plot->DrawGraph();