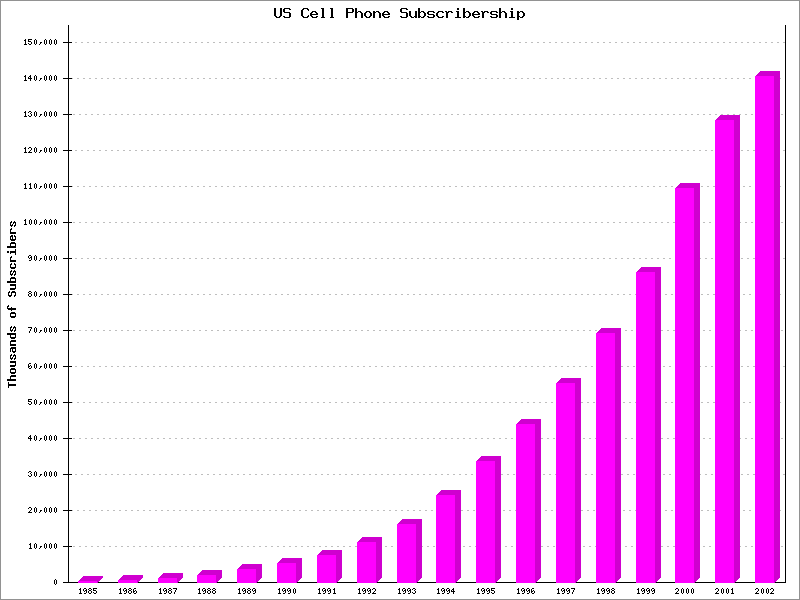
This is a bar chart showing data per year. Because the Y values are so large, we enable numeric formatting of Y labels, with precision 0. This results in a comma separator between thousands. This example also shows how to force the Y tick marks to start at zero and use a nice whole number for the tick interval.
Example 5.6. Bar Chart - Label Options

<?php
# PHPlot Example: Bar chart, annual data
require_once 'phplot.php';

$data = array(
  array('1985', 340),    array('1986', 682),    array('1987', 1231),
  array('1988', 2069),   array('1989', 3509),   array('1990', 5283),
  array('1991', 7557),   array('1992', 11033),  array('1993', 16009),
  array('1994', 24134),  array('1995', 33768),  array('1996', 44043),
  array('1997', 55312),  array('1998', 69209),  array('1999', 86047),
  array('2000', 109478), array('2001', 128375), array('2002', 140767),
);

$plot = new PHPlot(800, 600);
$plot->SetImageBorderType('plain');

$plot->SetPlotType('bars');
$plot->SetDataType('text-data');
$plot->SetDataValues($data);

# Let's use a new color for these bars:
$plot->SetDataColors('magenta');

# Force bottom to Y=0 and set reasonable tick interval:
$plot->SetPlotAreaWorld(NULL, 0, NULL, NULL);
$plot->SetYTickIncrement(10000);
# Format the Y tick labels as numerics to get thousands separators:
$plot->SetYLabelType('data');
$plot->SetPrecisionY(0);

# Main plot title:
$plot->SetTitle('US Cell Phone Subscribership');
# Y Axis title:
$plot->SetYTitle('Thousands of Subscribers');

# Turn off X tick labels and ticks because they don't apply here:
$plot->SetXTickLabelPos('none');
$plot->SetXTickPos('none');

$plot->DrawGraph();